%20(1).webp)
The digital world has many metrics, and knowing which ones matter for your success is hard. But tracking the right B2B website metrics is crucial to improve Conversion Rate Optimization (CRO). These metrics give you valuable information about how users behave on your website and what they like so that you can adjust your marketing strategies accordingly.
This article will cover the most important B2B website metrics to monitor and how to use them to optimize your conversion rate strategy.
The Importance of B2B Website Metrics for CRO
B2B website metrics are more than just numbers; they guide businesses to understand their audience's behavior and preferences, which is crucial for conversion rate optimization.
Measuring engagement, such as time spent on a page or bounce rate, provides insight into audience expectations and needs. By tracking and analyzing these metrics, businesses can identify areas for improvement and implement data-driven optimizations to improve conversion rates on their B2B website.
Essential B2B Website Metrics to Track
Tracking B2B website metrics is essential for understanding the effectiveness of your digital marketing efforts and optimizing your website to generate more leads and conversions. Here are some crucial B2B website metrics to track:
1. Website Engagement Metrics
(i) Time on Page
Time on page is a popular engagement metric favored by most marketers. It measures the average amount of time users spend on a specific page of your website. This metric is essential as it indicates interest and engagement with your content. To illustrate this, think about a clothing outlet – the longer you spend in the shop, the more likely you are to purchase.
A higher time on the page is desirable as it shows that your page successfully captures and retains users' attention, accomplishing its intended purpose.
How do you track Time on Page?
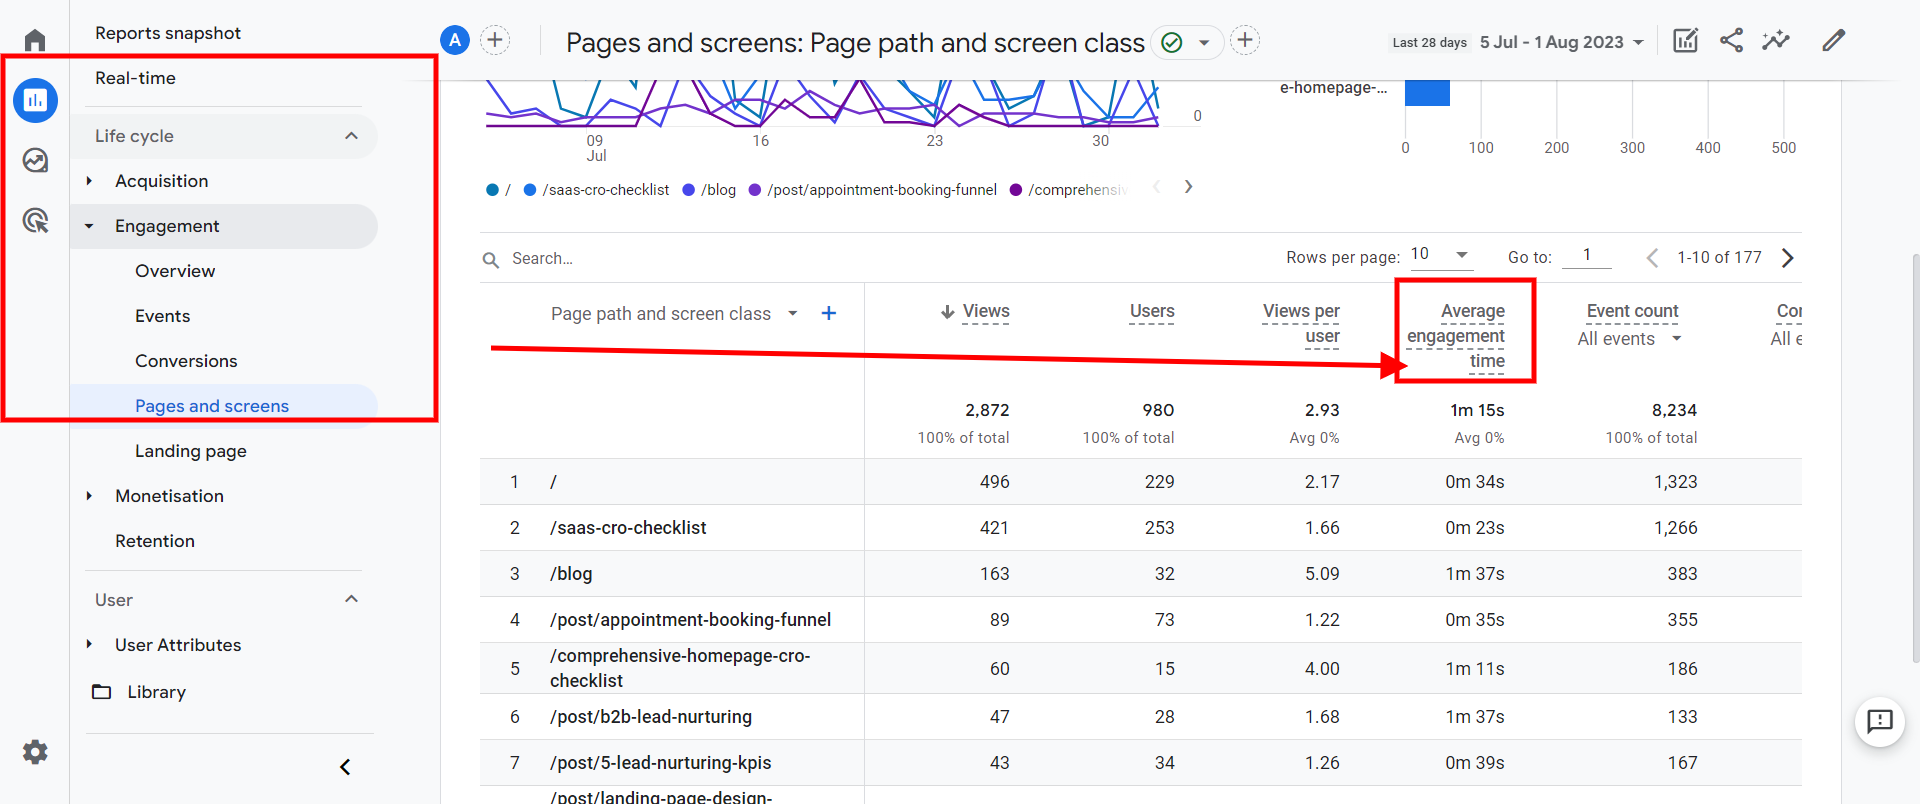
To calculate your average time on page, access Google Analytics. If you're using Google Analytics 4 (GA4), the metric is referred to as "average engagement time."
- Click on "Reports" and select "Engagement."
- Then, click on "Pages and screens."
- Scroll down to view the report of your page engagement metrics, including the average engagement time.
How to improve the time on page?
Consider adding more relevant internal links to optimize the time spent on your web pages. When viewers see these links, they may click on them and explore more content. This can keep them engaged and stay longer on different pages, which Google Analytics will track as accurate information about their time on your site.
(ii) Page Views
Page views are a critical engagement metric that shows how often people have visited specific web pages on your website within a specific time frame. By closely monitoring these numbers, you can understand which pages attract the most attention from your audience and which ones need improvement.
It helps you determine which content your visitors find interesting or less appealing. This information can guide you in creating more engaging and valuable content for your website visitors.
How to track page views in Google Analytics 4?
- Set up a GA4 Data Stream for your website or app by copying the Measurement ID from GA4 and implementing it in Google Tag Manager.
- Create a new tag in Google Tag Manager for "Google Analytics: GA4 Configuration" and provide the Measurement ID in the tag configuration.
- Select the trigger for this tag as "All Pages / Page View" to track page views on all pages of your website or app.
- Publish the Google Tag Manager container to collect data in your GA4 account.
- If your website is a one-page application, enable "Page changes based on browser history events" in GA4 Data Streams -> Web Stream -> Enhanced measurement to ensure tracking of all pages.
- To set up a virtual page view in GA4, send an additional event called "pageview" to GA4 using Google Tag Manager.
Once you've implemented the tracking and waited for at least 24 hours, you can access the page views data in Google Analytics 4 through the default report "Lifecycle collection -> Pages and screens." Additionally, you can use the GA4 Explore report to create custom reports with metrics and dimensions of your choice, including page views.
How to improve page views?
Promoting related articles at the end of each blog post to increase page views can encourage readers to explore more relevant content. Refine navigation across platforms for easy and efficient topic search.
Regular monitoring and analysis will reveal patterns over time regarding popular trends versus less frequented subjects - providing invaluable feedback guiding future marketing efforts accordingly.
(iii) Understand the Bounce Rate
Bounce rate signifies the percentage of visitors who land on your page but depart without exploring further content within your domain. A high bounce rate may suggest that users need help finding what they're searching for or encountering navigation challenges on your site.
How to track bounce rate on Google Analytics 4?
- On the top right of the report, click Customize Report.
- In the "REPORT DATA" section, choose the desired metrics - Engagement and Bounce rate metrics.
- Once selected, click on "Apply."
- Save your changes by clicking "Save" and selecting "Save changes to the current report."
How to reduce the bounce rate?
To lower bounce rates, provide relevant content aligned with the searcher's intent. Tailor content to meet specific needs, ensuring quick page loading and easy navigation. Use clear calls to action to encourage further exploration. Analyze user behavior and make data-driven improvements for a seamless, engaging experience, increasing conversion potential.
2. Analyzing Traffic Sources
When optimizing user acquisition and enhancing conversion rates for B2B websites, understanding your website traffic sources and tracking B2B website metrics cannot be overstated.
Identifying where visitors are coming from allows you to tailor marketing strategies effectively, addressing underperforming areas while capitalizing on high-potential ones.
This approach provides a bird's-eye view of how our marketing campaigns bring traffic to the site and drive overall growth and engagement. It allows us to assess the effectiveness of each marketing channel and make data-driven decisions to optimize our strategies for better results.
How to view traffic sources in Google Analytics 4 (GA4)?
- Open your Google Analytics account, navigate to the desired property, and view it.
- In the left-hand menu, click on "Reports."
- Under the "Reports" section, click on "Acquisition."
- Within the Acquisition reports, you will find three reports: "Acquisition Overview," "User Acquisition," and "Traffic Acquisition."
- The "Traffic Acquisition" report is the one you're looking for to view traffic sources similar to the Source / Medium report in Universal Analytics.
- Click on "Traffic Acquisition" to access the report.
In the "Traffic Acquisition" report, you'll be able to see detailed information about the sources of your website traffic. It will provide insights into which channels (e.g., organic search, direct, referral, social, etc.) drive traffic to your website and how users reach it. You can also analyze the performance of your marketing efforts based on different traffic sources.
3. Conversion Metrics
Conversions refer to specific user actions that result in lead generation, typically achieved through online form submissions. These actions include downloading content, indicating interest in a demo, requesting a quote, and representing different sales funnel stages, from top to mid-funnel and bottom funnel.
These lead-generating conversions are crucial metrics to track and form the foundation of B2B website performance evaluation. By monitoring and analyzing these conversions, businesses can gain valuable insights into their website's effectiveness in attracting and engaging potential customers, ultimately driving growth and success in the B2B domain.
How to track conversion metrics in GA4
Conversion metrics are available in all Acquisition and User reports, and a summary of all conversions can be seen in the Engagement -> Conversions Report.
But in GA4, you need to set up "Events" or "Goals" to track metric conversions. Let’s see how:
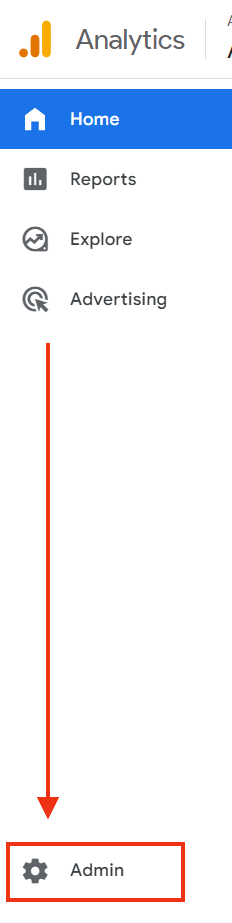
Click Admin in the left nav at the bottom:
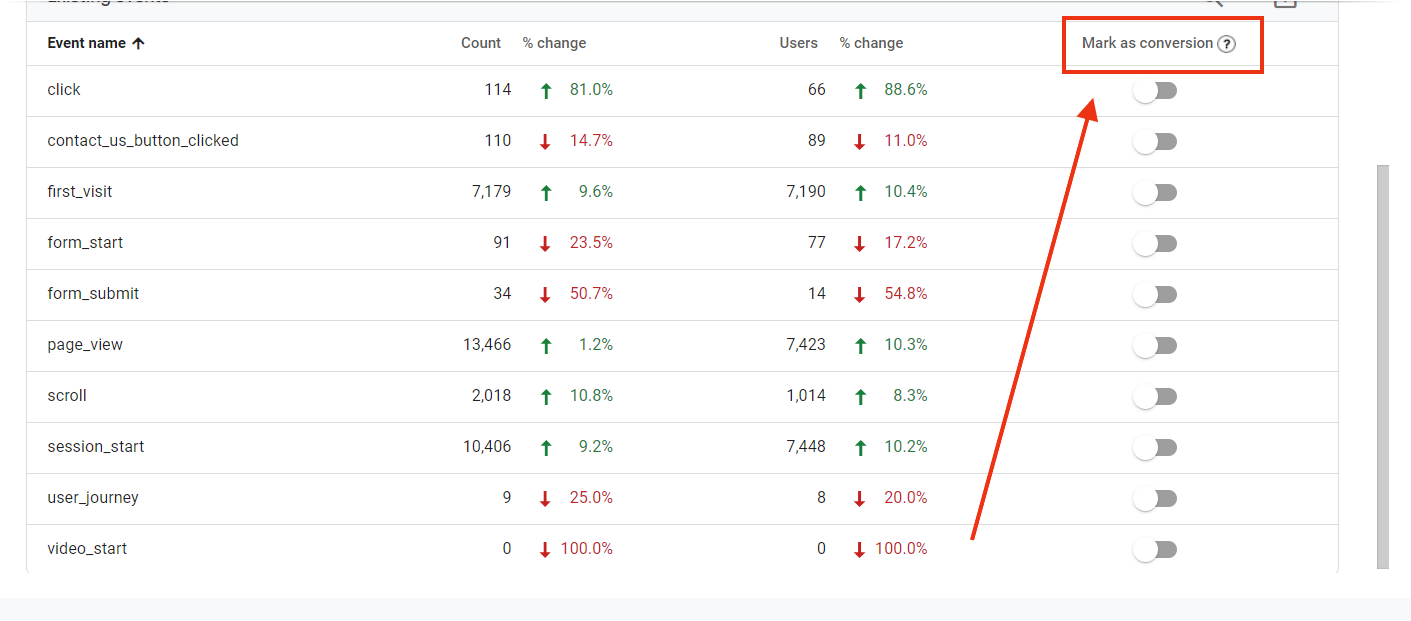
Within the "Events" section, you can track specific events as conversions by toggling the switch on the right to mark them as conversions.
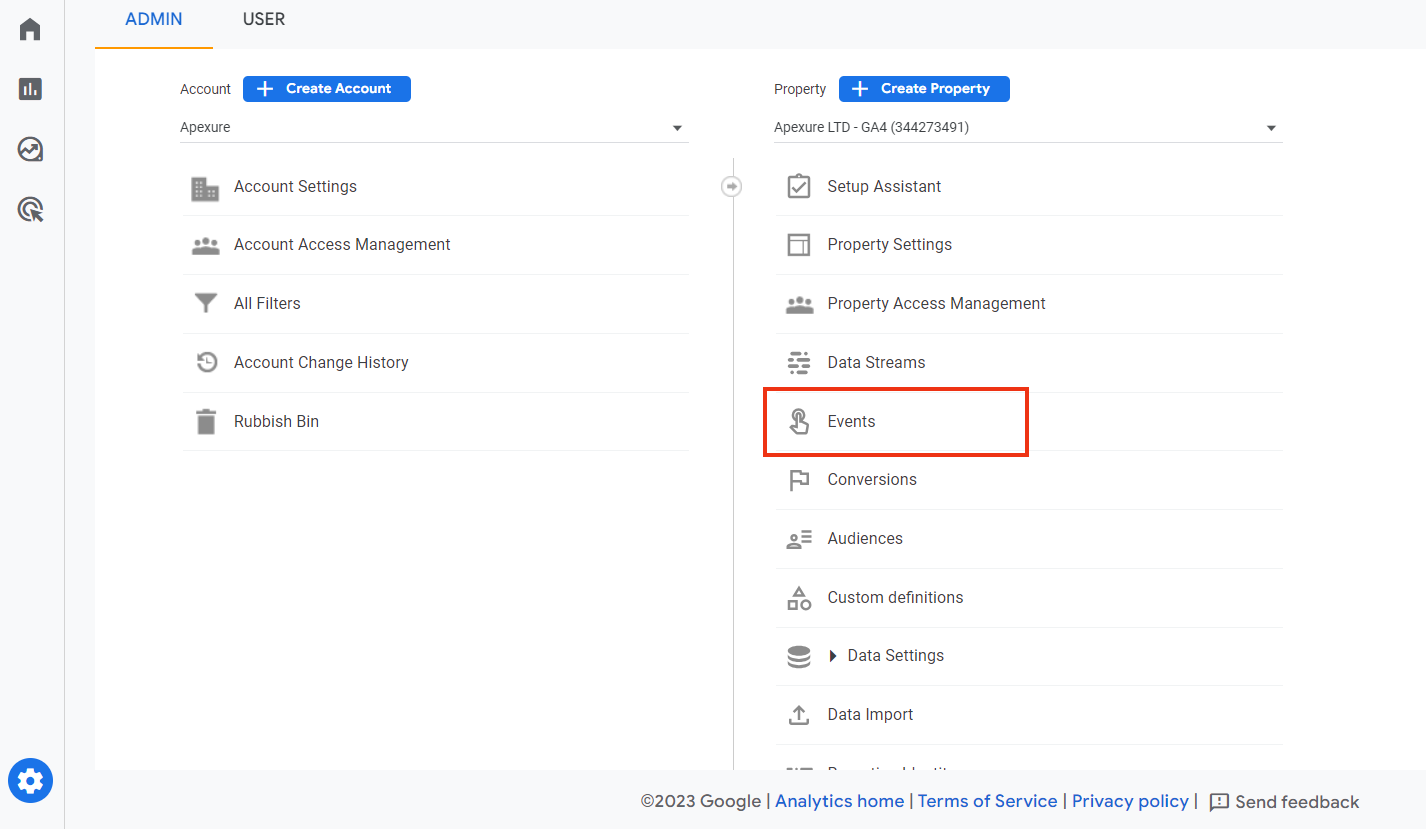
If you want to create a new conversion event, click on "Admin" again and select "Conversions" under the "Property" column.
Click the "New conversion event" button. In the "New event name" field, enter the name of your new conversion event, making sure it matches the name used for the event on the "Events" page.
.png)
Click "Save" to create the new conversion event, and you're all set!
When you access the "Conversions" page, you will see a list and count of all the conversion events within your specified date range. You can gain more insights into these conversion events by exploring the various reports available in Google Analytics 4.
4. SEO Metrics
SEO is critical for B2B digital marketing strategies, helping B2B businesses improve their online presence and attract potential clients. Several key SEO metrics come into play, including keyword rankings, backlink count, and Page speed.
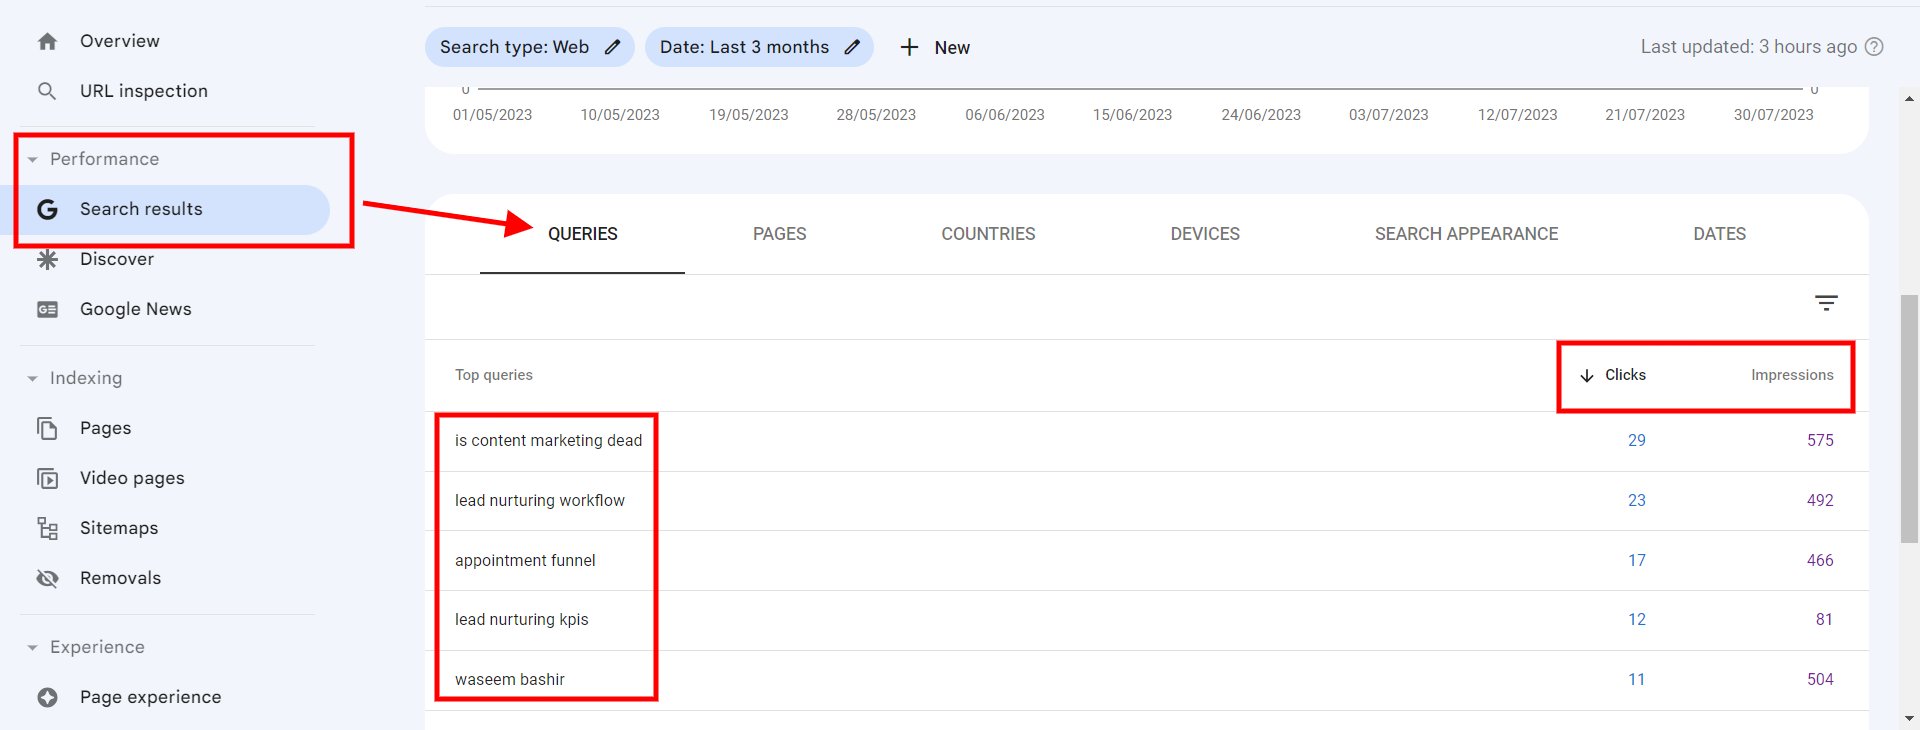
(i) Keyword ranking
It refers to the position of your website when users type in specific phrases or keywords into a search bar. Achieving a higher rank places your website closer to the top of SERPs, increasing visibility and the potential for user clicks. It's like finding yourself in the front row center stage, where everyone can see you.
Where to find it?
You can discover the keywords or search queries people use to find your website by accessing Google Search Console. To access this information, navigate to the dashboard and Performance > Search Results.
In this report, you will find a list of queries and pages, and you can sort the data based on clicks and impressions to gain valuable insights into your website's search performance.

(ii) Backlinks
Backlinks, conversely, are nods from other websites that signal their vote of confidence towards your website by linking to it within their content. Consider it a popularity contest for web pages, where more backlinks from reputable sources can positively impact your website's authority and search engine rankings.
How to find backlinks?
- After setting up your website in GSC, you can access the "Links" section and choose "External links" to view the backlink report.
- This report displays all the external websites that have linked to your website.
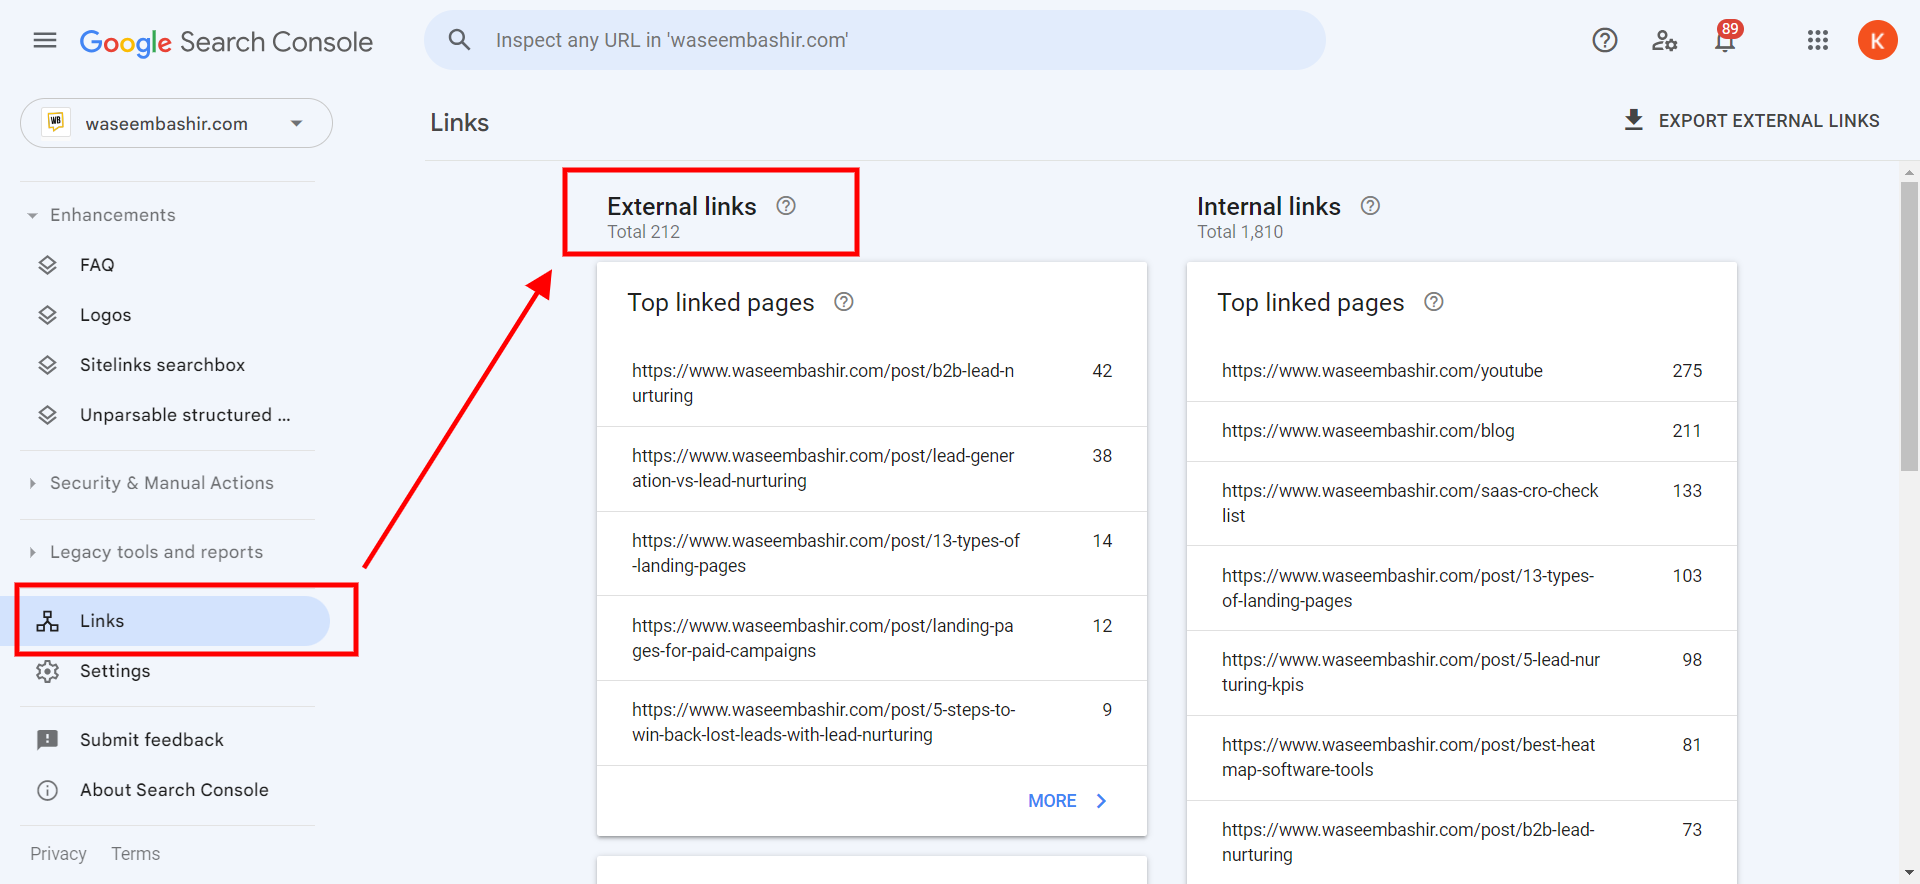
However, for more detailed and in-depth insights into your backlinks, you might need to explore additional tools or resources like Ahrefs and SEMRUSH; these tools can assist you in effectively analyzing backlinks and improving your website's performance.
How to gain quality backlinks?
The key to successful backlink acquisition is to focus on quality over quantity. Aim to earn backlinks from relevant and authoritative websites within your niche. Avoid spammy practices or purchasing backlinks, as search engines penalize such tactics.
(iii) Site Speed
Your webpage loading speed has quite an impact, too - not just on user experience but also on how well you fare in terms of SEO ranking. Imagine waiting forever for a page to load, only to abandon the ship out of frustration?
Well, Google found that 53% of mobile visits were abandoned if pages took longer than three seconds to load. So optimizing site speed isn't merely about keeping visitors happy; it directly affects your standing among SERPs.
How to check site speed?
Use online tools such as Google PageSpeed Insights or GTmetrix, offering detailed insights into possible culprits slowing down your sites and actionable recommendations like compressing images or reducing server response time.
5. Overall Usability
A subpar user experience significantly reduces the likelihood of successful lead conversion, as visitors will likely stay on your site for a short time. To increase the chances of conversion, your website must provide a seamless digital experience that allows visitors to easily find what they need or, even better, purchase from you.
A UX heatmap provides valuable insights into your visitors' preferences and highlights areas where a webpage may be lacking. By analyzing prospects' conversion behavior, you can improve your website and landing page design and copy, resulting in more effective and user-friendly experiences.
Important Suggestion: By following CRO best practices for B2B websites, you can create a more engaging and user-friendly site.
How to check and improve website user experience?
Google Analytics provides insights into website activity, while heatmap tools like Hotjar, Crazy Egg, and Microsoft Clarity can capture heatmaps that show the "why" behind user behavior.
To learn more about heatmaps for user experience, check out this blog:
Ready to Track B2B website metrics
By tracking the right B2B website metrics is vital for successful Conversion Rate Optimization (CRO). These metrics provide valuable insights into how users behave on your website and can guide you in adjusting your marketing strategies to generate more leads and conversions.
Regularly monitoring and analyzing these metrics empowers you to make data-driven decisions, leading to improved website performance, enhanced user experience, and better results for your B2B business.
Introducing our game-changing B2B CRO Checklist - a comprehensive tool to boost conversion rates. Prioritize, optimize, and achieve remarkable results in the competitive B2B market. Unlock your website's potential now!
Also Check:
Optimizing B2B SaaS Website Design for Better Conversions
B2B Startup Marketing Guide: Key Elements and Strategies
Effective B2B Content Distribution Strategies for Marketers
Website Audit Cost Reduction Tips: Unlock Savings
Effective B2B Website Strategy
B2B Website Best Practices For Lead Generation
